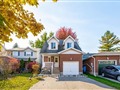
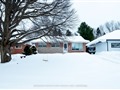
53 Second St
$664,643
Comparative Market Analysis
Jul 1, 2025
NOT AN ACTIVE LISTING
Historical Performance
| Period | $ Change | % Change |
| 1 Day | +$44 | +0.007% |
| 7 Days | -$373 | -0.056% |
| 30 Days | -$2,199 | -0.330% |
| 3 Months | -$2,887 | -0.432% |
| 6 Months | +$11.2k | +1.71% |
| 1 Year | -$33.6k | -4.81% |
| 3 Years | +$108k | +19.5% |
| 5 Years | +$176k | +36.1% |
| 10 Years | +$354k | +114% |
List My Property
Real Estate Statistics
Financing Solutions
Browsing History
39 Aiken Cres, Orangeville
2 seconds ago
3 Harshaw Rd, Orangeville
3 seconds ago
137 Bythia St, Orangeville
4 seconds ago
14 Aiken Cres, Orangeville
5 seconds ago
55 Eastview Cres, Orangeville
6 seconds ago
68 Bythia St, Orangeville
7 seconds ago
28 Newton Dr, Orangeville
8 seconds ago
5 Loyalist St, Orangeville
9 seconds ago
14 James Arnott Cres, Orangeville
10 seconds ago
AS SEEN ON


Are You a Licensed Real Estate Agent or Broker?