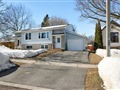
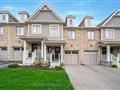
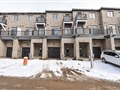
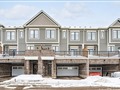
43 Quarry Dr
$654,017
Comparative Market Analysis
Jul 1, 2025
NOT AN ACTIVE LISTING
Historical Performance
| Period | $ Change | % Change |
| 1 Day | +$464 | +0.071% |
| 7 Days | +$1,635 | +0.251% |
| 30 Days | -$936 | -0.143% |
| 3 Months | -$3,842 | -0.584% |
| 6 Months | +$9,686 | +1.50% |
| 1 Year | -$28.2k | -4.13% |
| 3 Years | +$94.8k | +17.0% |
| 5 Years | +$193k | +41.8% |
| 10 Years | +$359k | +122% |
List My Property
Real Estate Statistics
Financing Solutions
Browsing History
37 Quarry Dr, Orangeville
3 seconds ago
AS SEEN ON


Are You a Licensed Real Estate Agent or Broker?