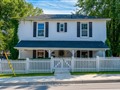
29 John St
$675,103
Comparative Market Analysis
Jun 30, 2025
NOT AN ACTIVE LISTING
Historical Performance
| Period | $ Change | % Change |
| 1 Day | +$45 | +0.007% |
| 7 Days | -$392 | -0.058% |
| 30 Days | -$2,301 | -0.340% |
| 3 Months | -$3,150 | -0.464% |
| 6 Months | +$10.9k | +1.64% |
| 1 Year | -$35.1k | -4.95% |
| 3 Years | +$107k | +18.8% |
| 5 Years | +$173k | +34.5% |
| 10 Years | +$351k | +108% |
List My Property
Real Estate Statistics
Financing Solutions
Browsing History
60 First St 12, Orangeville
5 seconds ago
AS SEEN ON


Are You a Licensed Real Estate Agent or Broker?