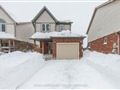
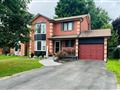
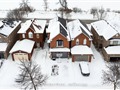
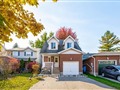
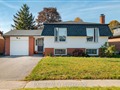
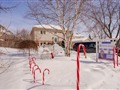
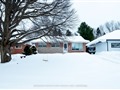
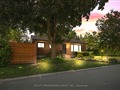
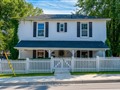
23 Morrow Cres
$1,106,657
Comparative Market Analysis
Jul 1, 2025
NOT AN ACTIVE LISTING
Historical Performance
| Period | $ Change | % Change |
| 1 Day | +$74 | +0.007% |
| 7 Days | -$490 | -0.044% |
| 30 Days | -$3,016 | -0.272% |
| 3 Months | -$2,684 | -0.242% |
| 6 Months | +$23.0k | +2.13% |
| 1 Year | -$45.2k | -3.92% |
| 3 Years | +$218k | +24.5% |
| 5 Years | +$359k | +48.1% |
| 10 Years | +$571k | +107% |
List My Property
Real Estate Statistics
Financing Solutions
Browsing History
20 Glenforest Rd, Orangeville
2 seconds ago
67 Burbank Cres, Orangeville
3 seconds ago
85 Benjamin Cres, Orangeville
4 seconds ago
6 Lakeview Crt, Orangeville
5 seconds ago
312 Hansen Blvd, Orangeville
6 seconds ago
100 Biscayne Cres, Orangeville
7 seconds ago
30 Shirley St, Orangeville
8 seconds ago
43 Biscayne Cres, Orangeville
9 seconds ago
14 Graham Cres, Orangeville
10 seconds ago
52 Pheasant Crt, Orangeville
11 seconds ago
AS SEEN ON


Are You a Licensed Real Estate Agent or Broker?