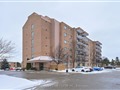
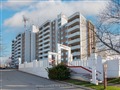
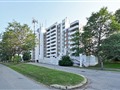
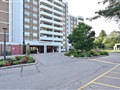
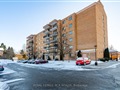
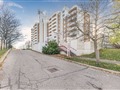
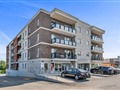
166 Broadway 2
$511,449
Comparative Market Analysis
Apr 30, 2025
NOT AN ACTIVE LISTING
Historical Performance
| Period | $ Change | % Change |
| 1 Day | +$603 | +0.118% |
| 7 Days | +$142 | +0.028% |
| 30 Days | +$1,807 | +0.355% |
| 3 Months | -$266 | -0.052% |
| 6 Months | +$2,105 | +0.413% |
| 1 Year | -$28.5k | -5.28% |
| 3 Years | +$76.4k | +17.5% |
| 5 Years | +$137k | +36.6% |
| 10 Years | +$294k | +136% |
List My Property
Real Estate Statistics
Financing Solutions
AS SEEN ON


Are You a Licensed Real Estate Agent or Broker?